Accueil » Power BI integration
Solutions
Power BI integration
In a nutshell
Understand Business Intelligence (BI)
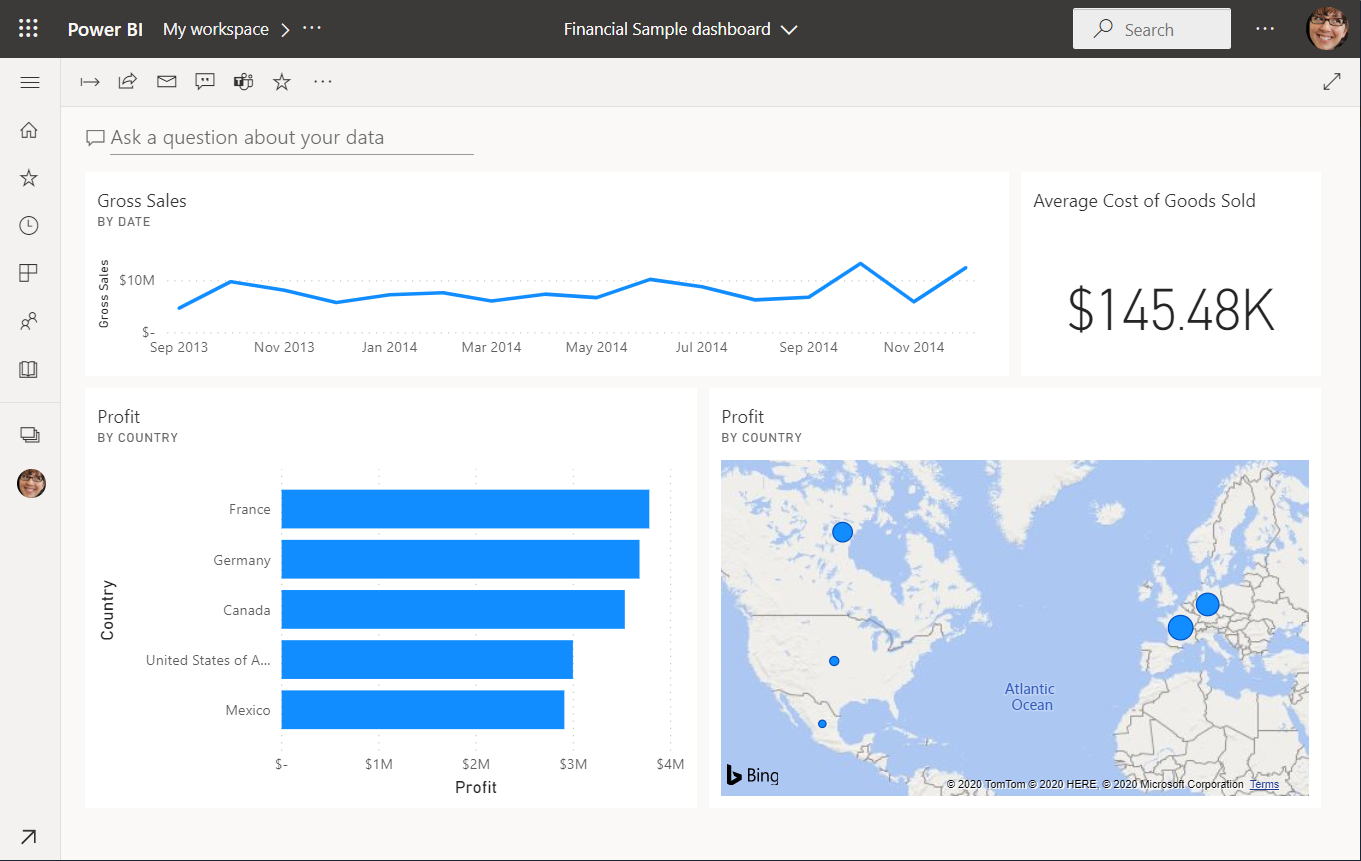
Our eProject work management platform integrates Business Intelligence tools that allow the processing of a multitude of data from the platform in real time for the development of dashboards.
These dashboards and reports help you make decisions in the general management of the project in order to detect potential problems as early as possible.
These dashboards are produced using Microsoft’s Power BI solution, which allows all project managers to produce their own table.
Understand the stakes of your project at a glance!
As your project progresses, the site data securely stored on the eProject platform will be processed by Business Intelligence tools.
The dashboards allow you to monitor the progress of construction, logistics and schedules. Combined with your BIM tools, you can develop a better understanding of your project’s progress.
Customize your indicators and visualize what is important for your project!

Benefits
What does Power BI do for you?

Decision making
Key indicators, cross-referencing of information, global visualization of the project, trends, data analysis for strategic decisions
Collaboration
Communication and sharing between collaborators, easy access to data for authorized actors

Personalisation
KPIs relevant to the project, easy customization of indicators, customization of the data used (BIM)
The eProject platform
Functionalities
Power BI Pro version integration
Microsoft PowerBI allows the extraction and visualization of multi-source data.
You can customize reports and charts with the most relevant indicators for your project easily.
You can also directly connect to the database or to your PowerBI Pro account to export or customize the basic report provided by eProject.
Dashboards and reporting are very powerful when connected to BIM databases. Indeed, BIM is a rich and complete source of data that has become virtually indispensable in the management of your construction project!
By integrating your BIM model into Power BI, you can make sense of your data, analyze and visualize what is important for your project.
eProject integrates BIM models with BimTrack, fully compatible with dashboard visualization and reporting.
The Power BI application is available as a SaaS, desktop and mobile application. You can access your reports in the office or on the job site.
All dashboards can be shared with all stakeholders, wherever they are, thus facilitating collaboration between stakeholders.
Other functionalities
Viewing the reporting tables is very simple.
At the start of the project, you can choose your filters and your report models or templates. Afterwards, you can link your Power BI pro account to the platform if you have one.
The dashboards are very easy to customize and to take in hand, thanks to a Drag and Drop system. You can also check and uncheck the values you are interested in with one click.
An effortless construction site management?
Mezzoteam Team
Related Services
Setup and training
- List creation
- Access rights
- Platform customization
- User training
Support and follow-up
- Hotline
- Developer support
- Proposal integration
- Users club
Consulting and advising
- Construction sector expertise
- IT and development professionals
- Customized document solutions

